Search for Indicators
All Data
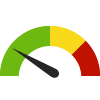
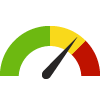
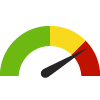
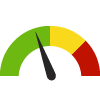
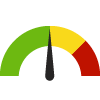
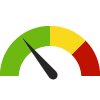
Indicator Gauge Icon Legend
Legend Colors
Red is bad, green is good, blue is not statistically different/neutral.
Compared to Distribution
 the value is in the best half of communities.
 the value is in the 2nd worst quarter of communities.
 the value is in the worst quarter of communities.
Compared to Target
 meets target;
  does not meet target.
Compared to a Single Value
 lower than the comparison value;
 higher than the comparison value;
 not statistically different from comparison value.
Trend

 non-significant change over time;
 significant change over time;
  no change over time.
Compared to Prior Value
 higher than the previous measurement period;
 lower than the previous measurement period;
 no statistically different change from previous measurement period.
County: Blackford
Health / Alcohol & Drug Use
Value
Compared to:
County: Blackford Adults who Binge Drink
County: Blackford Adults who Binge Drink
13.8%
(2021)
Compared to:
IN Counties
The distribution is based on data from 92 Indiana counties.
U.S. Counties
The distribution is based on data from 3,074 U.S. counties and county equivalents.
US Value
(15.5%)
The regional value is compared to the national value.
County: Blackford Adults who Drink Excessively
County: Blackford Adults who Drink Excessively
14.7%
(2021)
Compared to:
IN Counties
The distribution is based on data from 92 Indiana counties.
U.S. Counties
The distribution is based on data from 3,141 U.S. counties and county equivalents.
IN Value
(18.2%)
The regional value is compared to the Indiana State value.
US Value
(18.1%)
The regional value is compared to the national value.
Prior Value
(17.9%)
Prior Value compares a measured value with the previously measured value. Confidence intervals were taken into account in determining the direction of the comparison.
Trend
This comparison measures the indicator’s values over multiple time periods.<br>The Mann-Kendall Test for Statistical Significance is used to evaluate the trend<br>over 4 to 10 periods of measure, subject to data availability and comparability.
County: Blackford Death Rate due to Drug Poisoning
County: Blackford Death Rate due to Drug Poisoning
33.7
Deaths per 100,000 population
(2019-2021)
Compared to:

IN Counties
The distribution is based on data from 78 Indiana counties.
U.S. Counties
The distribution is based on data from 1,899 U.S. counties and county equivalents.
IN Value
(33.7)
The regional value is compared to the Indiana State value.
US Value
(27.2)
The regional value is compared to the national value.
HP 2030 Target
(20.7)
<div>SU-03: Reduce drug overdose deaths <strong>(LEADING HEALTH INDICATOR)</strong></div>
County: Blackford Heroin Treatment Rate
County: Blackford Heroin Treatment Rate
52.80
Admissions per 1,000 population
(2020)
Compared to:


IN Value
(23.60)
The regional value is compared to the Indiana State value.
Prior Value
(57.40)
Prior Value compares a measured value with the previously measured value. Confidence intervals were not taken into account in determining the direction of the comparison.
Trend
This comparison measures the indicator’s values over multiple time periods.<br>The Mann-Kendall Test for Statistical Significance is used to evaluate the trend<br>over 4 to 10 periods of measure, subject to data availability and comparability.
County: Blackford Methamphetamine Treatment Rate
County: Blackford Methamphetamine Treatment Rate
75.00
Admissions per 1,000 population
(2020)
Compared to:


IN Value
(41.20)
The regional value is compared to the Indiana State value.
Prior Value
(64.80)
Prior Value compares a measured value with the previously measured value. Confidence intervals were not taken into account in determining the direction of the comparison.
Trend
This comparison measures the indicator’s values over multiple time periods.<br>The Mann-Kendall Test for Statistical Significance is used to evaluate the trend<br>over 4 to 10 periods of measure, subject to data availability and comparability.
County: Blackford Non-Fatal Emergency Department Visits due to Opioid Overdoses
County: Blackford Non-Fatal Emergency Department Visits due to Opioid Overdoses
192.8
Rate per 100,000 population
(2018)
Compared to:

IN Counties
The distribution is based on data from 92 Indiana counties.
IN Value
(87.0)
The regional value is compared to the Indiana State value.
Prior Value
(250.5)
Prior Value compares a measured value with the previously measured value. Confidence intervals were not taken into account in determining the direction of the comparison.
County: Blackford
Health / Cancer
Value
Compared to:
County: Blackford Adults with Cancer
County: Blackford Adults with Cancer
8.6%
(2021)
Compared to:
IN Counties
The distribution is based on data from 92 Indiana counties.
U.S. Counties
The distribution is based on data from 3,074 U.S. counties and county equivalents.
US Value
(7.0%)
The regional value is compared to the national value.
County: Blackford Age-Adjusted Death Rate due to Colorectal Cancer
County: Blackford Age-Adjusted Death Rate due to Colorectal Cancer
18.3
Deaths per 100,000 population
(2015-2019)
Compared to:
IN Counties
The distribution is based on data from 80 Indiana counties.
U.S. Counties
The distribution is based on data from 2,177 U.S. counties and county equivalents.
IN Value
(14.9)
The regional value is compared to the Indiana State value.
US Value
(13.4)
The regional value is compared to the national value.
Prior Value
(22.9)
Prior Value compares a measured value with the previously measured value. Confidence intervals were taken into account in determining the direction of the comparison.
Trend
This comparison measures the indicator’s values over multiple time periods.<br>The Mann-Kendall Test for Statistical Significance is used to evaluate the trend<br>over 4 to 10 periods of measure, subject to data availability and comparability.
HP 2030 Target
(8.9)
County: Blackford Age-Adjusted Death Rate due to Lung Cancer
County: Blackford Age-Adjusted Death Rate due to Lung Cancer
63.1
Deaths per 100,000 population
(2016-2020)
Compared to:

IN Counties
The distribution is based on data from 92 Indiana counties.
U.S. Counties
The distribution is based on data from 2,752 U.S. counties and county equivalents.
IN Value
(44.9)
The regional value is compared to the Indiana State value.
US Value
(35.0)
The regional value is compared to the national value.
Prior Value
(61.0)
Prior Value compares a measured value with the previously measured value. Confidence intervals were taken into account in determining the direction of the comparison.
Trend
This comparison measures the indicator’s values over multiple time periods.<br>The Mann-Kendall Test for Statistical Significance is used to evaluate the trend<br>over 4 to 10 periods of measure, subject to data availability and comparability.
HP 2030 Target
(25.1)
County: Blackford Breast Cancer Incidence Rate
County: Blackford Breast Cancer Incidence Rate
117.5
Cases per 100,000 females
(2015-2019)
Compared to:

IN Counties
The distribution is based on data from 91 Indiana counties.
U.S. Counties
The distribution is based on data from 2,706 U.S. counties and county equivalents.
IN Value
(124.3)
The regional value is compared to the Indiana State value.
US Value
(128.1)
The regional value is compared to the national value.
Prior Value
(121.5)
Prior Value compares a measured value with the previously measured value. Confidence intervals were taken into account in determining the direction of the comparison.
Trend
This comparison measures the indicator’s values over multiple time periods.<br>The Mann-Kendall Test for Statistical Significance is used to evaluate the trend<br>over 4 to 10 periods of measure, subject to data availability and comparability.
County: Blackford Cancer: Medicare Population
County: Blackford Cancer: Medicare Population
11.0%
(2022)
Compared to:

IN Counties
The distribution is based on data from 92 Indiana counties.
U.S. Counties
The distribution is based on data from 3,129 U.S. counties and county equivalents.
IN Value
(11.0%)
The regional value is compared to the Indiana State value.
US Value
(12.0%)
The regional value is compared to the national value.
Prior Value
(10.0%)
Prior Value compares a measured value with the previously measured value. Confidence intervals were not taken into account in determining the direction of the comparison.
Trend
This comparison measures the indicator’s values over multiple time periods.<br>The Mann-Kendall Test for Statistical Significance is used to evaluate the trend<br>over 4 to 10 periods of measure, subject to data availability and comparability.
County: Blackford Cervical Cancer Screening: 21-65
County: Blackford Cervical Cancer Screening: 21-65
79.3%
(2020)
Compared to:

IN Counties
The distribution is based on data from 92 Indiana counties.
U.S. Counties
The distribution is based on data from 3,141 U.S. counties and county equivalents.
US Value
(82.8%)
The regional value is compared to the national value.
County: Blackford Colon Cancer Screening: USPSTF Recommendation
County: Blackford Colon Cancer Screening: USPSTF Recommendation
68.5%
(2020)
Compared to:
IN Counties
The distribution is based on data from 92 Indiana counties.
U.S. Counties
The distribution is based on data from 3,141 U.S. counties and county equivalents.
US Value
(72.4%)
The regional value is compared to the national value.
County: Blackford Colorectal Cancer Incidence Rate
County: Blackford Colorectal Cancer Incidence Rate
52.2
Cases per 100,000 population
(2015-2019)
Compared to:
IN Counties
The distribution is based on data from 92 Indiana counties.
U.S. Counties
The distribution is based on data from 2,628 U.S. counties and county equivalents.
IN Value
(41.1)
The regional value is compared to the Indiana State value.
US Value
(37.7)
The regional value is compared to the national value.
Prior Value
(52.1)
Prior Value compares a measured value with the previously measured value. Confidence intervals were taken into account in determining the direction of the comparison.
Trend
This comparison measures the indicator’s values over multiple time periods.<br>The Mann-Kendall Test for Statistical Significance is used to evaluate the trend<br>over 4 to 10 periods of measure, subject to data availability and comparability.
County: Blackford Lung and Bronchus Cancer Incidence Rate
County: Blackford Lung and Bronchus Cancer Incidence Rate
87.8
Cases per 100,000 population
(2015-2019)
Compared to:
IN Counties
The distribution is based on data from 92 Indiana counties.
U.S. Counties
The distribution is based on data from 2,700 U.S. counties and county equivalents.
IN Value
(69.2)
The regional value is compared to the Indiana State value.
US Value
(56.3)
The regional value is compared to the national value.
Prior Value
(93.9)
Prior Value compares a measured value with the previously measured value. Confidence intervals were taken into account in determining the direction of the comparison.
Trend
This comparison measures the indicator’s values over multiple time periods.<br>The Mann-Kendall Test for Statistical Significance is used to evaluate the trend<br>over 4 to 10 periods of measure, subject to data availability and comparability.
County: Blackford Mammogram in Past 2 Years: 50-74
County: Blackford Mammogram in Past 2 Years: 50-74
65.7%
(2020)
Compared to:
IN Counties
The distribution is based on data from 92 Indiana counties.
U.S. Counties
The distribution is based on data from 3,141 U.S. counties and county equivalents.
US Value
(78.2%)
The regional value is compared to the national value.
HP 2030 Target
(80.3%)
County: Blackford Mammography Screening: Medicare Population
County: Blackford Mammography Screening: Medicare Population
43.0%
(2022)
Compared to:
IN Counties
The distribution is based on data from 92 Indiana counties.
U.S. Counties
The distribution is based on data from 3,123 U.S. counties and county equivalents.
IN Value
(49.0%)
The regional value is compared to the Indiana State value.
US Value
(47.0%)
The regional value is compared to the national value.
Prior Value
(40.0%)
Prior Value compares a measured value with the previously measured value. Confidence intervals were not taken into account in determining the direction of the comparison.
Trend
This comparison measures the indicator’s values over multiple time periods.<br>The Mann-Kendall Test for Statistical Significance is used to evaluate the trend<br>over 4 to 10 periods of measure, subject to data availability and comparability.
County: Blackford Prostate Cancer Incidence Rate
County: Blackford Prostate Cancer Incidence Rate
92.5
Cases per 100,000 males
(2015-2019)
Compared to:
IN Counties
The distribution is based on data from 92 Indiana counties.
U.S. Counties
The distribution is based on data from 2,712 U.S. counties and county equivalents.
IN Value
(99.9)
The regional value is compared to the Indiana State value.
US Value
(109.9)
The regional value is compared to the national value.
Prior Value
(88.7)
Prior Value compares a measured value with the previously measured value. Confidence intervals were taken into account in determining the direction of the comparison.
Trend
This comparison measures the indicator’s values over multiple time periods.<br>The Mann-Kendall Test for Statistical Significance is used to evaluate the trend<br>over 4 to 10 periods of measure, subject to data availability and comparability.
County: Blackford
Health / County Health Rankings
Value
Compared to:
County: Blackford Clinical Care Ranking
County: Blackford Clinical Care Ranking
41
(2023)
Compared to:
IN Counties
The distribution is based on data from 92 Indiana counties.
County: Blackford Health Behaviors Ranking
County: Blackford Health Behaviors Ranking
91
(2023)
Compared to:
IN Counties
The distribution is based on data from 92 Indiana counties.
County: Blackford Morbidity Ranking
County: Blackford Morbidity Ranking
86
(2023)
Compared to:
IN Counties
The distribution is based on data from 92 Indiana counties.
County: Blackford Mortality Ranking
County: Blackford Mortality Ranking
76
(2023)
Compared to:
IN Counties
The distribution is based on data from 92 Indiana counties.
County: Blackford Physical Environment Ranking
County: Blackford Physical Environment Ranking
30
(2023)
Compared to:
IN Counties
The distribution is based on data from 92 Indiana counties.
County: Blackford Social and Economic Factors Ranking
County: Blackford Social and Economic Factors Ranking
71
(2023)
Compared to:
IN Counties
The distribution is based on data from 92 Indiana counties.
County: Blackford
Health / Diabetes
Value
Compared to:
County: Blackford Adults 20+ with Diabetes
County: Blackford Adults 20+ with Diabetes
8.6%
(2021)
Compared to:
IN Counties
The distribution is based on data from 92 Indiana counties.
U.S. Counties
The distribution is based on data from 3,074 U.S. counties and county equivalents.
Prior Value
(7.7%)
Prior Value compares a measured value with the previously measured value. Confidence intervals were taken into account in determining the direction of the comparison.
Trend
This comparison measures the indicator’s values over multiple time periods.<br>The Mann-Kendall Test for Statistical Significance is used to evaluate the trend<br>over 4 to 10 periods of measure, subject to data availability and comparability.
County: Blackford Age-Adjusted Death Rate due to Diabetes
County: Blackford Age-Adjusted Death Rate due to Diabetes
40.4
Deaths per 100,000 population
(2018-2020)
Compared to:
IN Counties
The distribution is based on data from 72 Indiana counties.
U.S. Counties
The distribution is based on data from 1,937 U.S. counties and county equivalents.
IN Value
(26.9)
The regional value is compared to the Indiana State value.
US Value
(22.6)
The regional value is compared to the national value.
Prior Value
(36.8)
Prior Value compares a measured value with the previously measured value. Confidence intervals were taken into account in determining the direction of the comparison.
Trend
This comparison measures the indicator’s values over multiple time periods.<br>The Mann-Kendall Test for Statistical Significance is used to evaluate the trend<br>over 4 to 10 periods of measure, subject to data availability and comparability.
County: Blackford Diabetes: Medicare Population
County: Blackford Diabetes: Medicare Population
30.0%
(2022)
Compared to:
IN Counties
The distribution is based on data from 92 Indiana counties.
U.S. Counties
The distribution is based on data from 3,129 U.S. counties and county equivalents.
IN Value
(26.0%)
The regional value is compared to the Indiana State value.
US Value
(24.0%)
The regional value is compared to the national value.
Prior Value
(29.0%)
Prior Value compares a measured value with the previously measured value. Confidence intervals were not taken into account in determining the direction of the comparison.
Trend
This comparison measures the indicator’s values over multiple time periods.<br>The Mann-Kendall Test for Statistical Significance is used to evaluate the trend<br>over 4 to 10 periods of measure, subject to data availability and comparability.
County: Blackford Diabetic Monitoring: Medicare Population
County: Blackford Diabetic Monitoring: Medicare Population
92.7%
(2019)
Compared to:
IN Counties
The distribution is based on data from 92 Indiana counties.
U.S. Counties
The distribution is based on data from 3,097 U.S. counties and county equivalents.
IN Value
(88.5%)
The regional value is compared to the Indiana State value.
US Value
(87.5%)
The regional value is compared to the national value.
Prior Value
(90.8%)
Prior Value compares a measured value with the previously measured value. Confidence intervals were taken into account in determining the direction of the comparison.
Trend
This comparison measures the indicator’s values over multiple time periods.<br>The Mann-Kendall Test for Statistical Significance is used to evaluate the trend<br>over 4 to 10 periods of measure, subject to data availability and comparability.
County: Blackford
Health / Disabilities
Value
Compared to:
County: Blackford Adults with Disability Living in Poverty
County: Blackford Adults with Disability Living in Poverty
40.8%
(2018-2022)
Compared to:
IN Counties
The distribution is based on data from 92 Indiana counties.
U.S. Counties
The distribution is based on data from 3,132 U.S. counties and county equivalents.
IN Value
(25.4%)
The regional value is compared to the Indiana State value.
US Value
(24.9%)
The regional value is compared to the national value.
Trend
This comparison measures the indicator’s values over multiple time periods.<br>The Mann-Kendall Test for Statistical Significance is used to evaluate the trend<br>over 4 to 10 periods of measure, subject to data availability and comparability.
County: Blackford Children with a Disability
County: Blackford Children with a Disability
9.9%
(2018-2022)
Compared to:
IN Value
(4.9%)
The regional value is compared to the Indiana State value.
US Value
(4.5%)
The regional value is compared to the national value.
Trend
This comparison measures the indicator’s values over multiple time periods.<br>The Mann-Kendall Test for Statistical Significance is used to evaluate the trend<br>over 4 to 10 periods of measure, subject to data availability and comparability.
County: Blackford Persons with a Cognitive Difficulty
County: Blackford Persons with a Cognitive Difficulty
10.3%
(2018-2022)
Compared to:
IN Value
(5.7%)
The regional value is compared to the Indiana State value.
US Value
(5.3%)
The regional value is compared to the national value.
Trend
This comparison measures the indicator’s values over multiple time periods.<br>The Mann-Kendall Test for Statistical Significance is used to evaluate the trend<br>over 4 to 10 periods of measure, subject to data availability and comparability.
County: Blackford Persons with a Disability
County: Blackford Persons with a Disability
21.3%
(2018-2022)
Compared to:
IN Value
(13.7%)
The regional value is compared to the Indiana State value.
US Value
(12.9%)
The regional value is compared to the national value.
Trend
This comparison measures the indicator’s values over multiple time periods.<br>The Mann-Kendall Test for Statistical Significance is used to evaluate the trend<br>over 4 to 10 periods of measure, subject to data availability and comparability.
County: Blackford Persons with a Hearing Difficulty
County: Blackford Persons with a Hearing Difficulty
5.9%
(2018-2022)
Compared to:
IN Value
(3.8%)
The regional value is compared to the Indiana State value.
US Value
(3.6%)
The regional value is compared to the national value.
Trend
This comparison measures the indicator’s values over multiple time periods.<br>The Mann-Kendall Test for Statistical Significance is used to evaluate the trend<br>over 4 to 10 periods of measure, subject to data availability and comparability.
County: Blackford Persons with a Self-Care Difficulty
County: Blackford Persons with a Self-Care Difficulty
4.5%
(2018-2022)
Compared to:
IN Value
(2.5%)
The regional value is compared to the Indiana State value.
US Value
(2.6%)
The regional value is compared to the national value.
Trend
This comparison measures the indicator’s values over multiple time periods.<br>The Mann-Kendall Test for Statistical Significance is used to evaluate the trend<br>over 4 to 10 periods of measure, subject to data availability and comparability.
County: Blackford Persons with a Vision Difficulty
County: Blackford Persons with a Vision Difficulty
5.2%
(2018-2022)
Compared to:
IN Value
(2.5%)
The regional value is compared to the Indiana State value.
US Value
(2.4%)
The regional value is compared to the national value.
Trend
This comparison measures the indicator’s values over multiple time periods.<br>The Mann-Kendall Test for Statistical Significance is used to evaluate the trend<br>over 4 to 10 periods of measure, subject to data availability and comparability.
County: Blackford Persons with an Ambulatory Difficulty
County: Blackford Persons with an Ambulatory Difficulty
12.2%
(2018-2022)
Compared to:
IN Value
(7.1%)
The regional value is compared to the Indiana State value.
US Value
(6.7%)
The regional value is compared to the national value.
Trend
This comparison measures the indicator’s values over multiple time periods.<br>The Mann-Kendall Test for Statistical Significance is used to evaluate the trend<br>over 4 to 10 periods of measure, subject to data availability and comparability.
County: Blackford
Health / Family Planning
Value
Compared to:
County: Blackford Teen Birth Rate: 15-19
County: Blackford Teen Birth Rate: 15-19
55.4
Live births per 1,000 females aged 15-19
(2011)
Compared to:
IN Counties
The distribution is based on data from 92 Indiana counties.
IN Value
(34.8)
The regional value is compared to the Indiana State value.
US Value
(31.3)
The regional value is compared to the national value. The source for the national value is Centers for Disease Control and Prevention, National Center for Health Statistics
County: Blackford
Health / Health Care Access & Quality
Value
Compared to:
County: Blackford Adults who have had a Routine Checkup
County: Blackford Adults who have had a Routine Checkup
77.6%
(2021)
Compared to:
IN Counties
The distribution is based on data from 92 Indiana counties.
U.S. Counties
The distribution is based on data from 3,074 U.S. counties and county equivalents.
US Value
(73.6%)
The regional value is compared to the national value.
County: Blackford Adults with Health Insurance: 18-64
County: Blackford Adults with Health Insurance: 18-64
90.6%
(2021)
Compared to:
IN Counties
The distribution is based on data from 92 Indiana counties.
U.S. Counties
The distribution is based on data from 3,140 U.S. counties and county equivalents.
IN Value
(89.8%)
The regional value is compared to the Indiana State value.
Prior Value
(90.1%)
Prior Value compares a measured value with the previously measured value. Confidence intervals were taken into account in determining the direction of the comparison.
Trend
This comparison measures the indicator’s values over multiple time periods.<br>The Mann-Kendall Test for Statistical Significance is used to evaluate the trend<br>over 4 to 10 periods of measure, subject to data availability and comparability.
County: Blackford Children with Health Insurance
County: Blackford Children with Health Insurance
94.8%
(2021)
Compared to:
IN Counties
The distribution is based on data from 92 Indiana counties.
U.S. Counties
The distribution is based on data from 3,140 U.S. counties and county equivalents.
IN Value
(94.1%)
The regional value is compared to the Indiana State value.
Prior Value
(94.2%)
Prior Value compares a measured value with the previously measured value. Confidence intervals were taken into account in determining the direction of the comparison.
Trend
This comparison measures the indicator’s values over multiple time periods.<br>The Mann-Kendall Test for Statistical Significance is used to evaluate the trend<br>over 4 to 10 periods of measure, subject to data availability and comparability.
County: Blackford Non-Physician Primary Care Provider Rate
County: Blackford Non-Physician Primary Care Provider Rate
42
Providers per 100,000 population
(2023)
Compared to:


IN Counties
The distribution is based on data from 91 Indiana counties.
U.S. Counties
The distribution is based on data from 3,129 U.S. counties and county equivalents.
IN Value
(130)
The regional value is compared to the Indiana State value.
Prior Value
(50)
Prior Value compares a measured value with the previously measured value. Confidence intervals were not taken into account in determining the direction of the comparison.
Trend
This comparison measures the indicator’s values over multiple time periods.<br>The Mann-Kendall Test for Statistical Significance is used to evaluate the trend<br>over 4 to 10 periods of measure, subject to data availability and comparability.
County: Blackford Persons with Health Insurance
County: Blackford Persons with Health Insurance
91.8%
(2021)
Compared to:
IN Counties
The distribution is based on data from 92 Indiana counties.
U.S. Counties
The distribution is based on data from 3,140 U.S. counties and county equivalents.
IN Value
(91.1%)
The regional value is compared to the Indiana State value.
Prior Value
(91.3%)
Prior Value compares a measured value with the previously measured value. Confidence intervals were taken into account in determining the direction of the comparison.
Trend
This comparison measures the indicator’s values over multiple time periods.<br>The Mann-Kendall Test for Statistical Significance is used to evaluate the trend<br>over 4 to 10 periods of measure, subject to data availability and comparability.
HP 2030 Target
(92.4%)
<div>AHS-01: Increase the proportion of people with health insurance <strong>(LEADING HEALTH INDICATOR)</strong></div>
County: Blackford Preventable Hospital Stays: Medicare Population
County: Blackford Preventable Hospital Stays: Medicare Population
1,700.0
Discharges per 100,000 Medicare enrollees
(2022)
Compared to:
IN Counties
The distribution is based on data from 92 Indiana counties.
U.S. Counties
The distribution is based on data from 3,129 U.S. counties and county equivalents.
IN Value
(3,099.0)
The regional value is compared to the Indiana State value.
US Value
(2,677.0)
The regional value is compared to the national value.
Prior Value
(1,828.0)
Prior Value compares a measured value with the previously measured value. Confidence intervals were not taken into account in determining the direction of the comparison.
Trend
This comparison measures the indicator’s values over multiple time periods.<br>The Mann-Kendall Test for Statistical Significance is used to evaluate the trend<br>over 4 to 10 periods of measure, subject to data availability and comparability.
County: Blackford Primary Care Provider Rate
County: Blackford Primary Care Provider Rate
66
Providers per 100,000 population
(2021)
Compared to:
IN Counties
The distribution is based on data from 89 Indiana counties.
U.S. Counties
The distribution is based on data from 2,984 U.S. counties and county equivalents.
IN Value
(66)
The regional value is compared to the Indiana State value.
Prior Value
(59)
Prior Value compares a measured value with the previously measured value. Confidence intervals were not taken into account in determining the direction of the comparison.
Trend
This comparison measures the indicator’s values over multiple time periods.<br>The Mann-Kendall Test for Statistical Significance is used to evaluate the trend<br>over 4 to 10 periods of measure, subject to data availability and comparability.
County: Blackford
Health / Health Information Technology
Value
Compared to:
County: Blackford Households with an Internet Subscription
County: Blackford Households with an Internet Subscription
84.2%
(2018-2022)
Compared to:
IN Counties
The distribution is based on data from 92 Indiana counties.
U.S. Counties
The distribution is based on data from 3,133 U.S. counties and county equivalents.
IN Value
(87.0%)
The regional value is compared to the Indiana State value.
US Value
(88.5%)
The regional value is compared to the national value.
Trend
This comparison measures the indicator’s values over multiple time periods.<br>The Mann-Kendall Test for Statistical Significance is used to evaluate the trend<br>over 4 to 10 periods of measure, subject to data availability and comparability.
County: Blackford Households with One or More Types of Computing Devices
County: Blackford Households with One or More Types of Computing Devices
89.2%
(2018-2022)
Compared to:
IN Counties
The distribution is based on data from 92 Indiana counties.
U.S. Counties
The distribution is based on data from 3,133 U.S. counties and county equivalents.
IN Value
(92.7%)
The regional value is compared to the Indiana State value.
US Value
(94.0%)
The regional value is compared to the national value.
Trend
This comparison measures the indicator’s values over multiple time periods.<br>The Mann-Kendall Test for Statistical Significance is used to evaluate the trend<br>over 4 to 10 periods of measure, subject to data availability and comparability.
County: Blackford Persons with an Internet Subscription
County: Blackford Persons with an Internet Subscription
89.8%
(2018-2022)
Compared to:
IN Counties
The distribution is based on data from 92 Indiana counties.
U.S. Counties
The distribution is based on data from 3,133 U.S. counties and county equivalents.
IN Value
(89.7%)
The regional value is compared to the Indiana State value.
US Value
(91.0%)
The regional value is compared to the national value.
Trend
This comparison measures the indicator’s values over multiple time periods.<br>The Mann-Kendall Test for Statistical Significance is used to evaluate the trend<br>over 4 to 10 periods of measure, subject to data availability and comparability.
County: Blackford
Health / Heart Disease & Stroke
Value
Compared to:
County: Blackford Adults who Experienced a Stroke
County: Blackford Adults who Experienced a Stroke
4.3%
(2021)
Compared to:
IN Counties
The distribution is based on data from 92 Indiana counties.
U.S. Counties
The distribution is based on data from 3,074 U.S. counties and county equivalents.
US Value
(3.3%)
The regional value is compared to the national value.
County: Blackford Adults who Experienced Coronary Heart Disease
County: Blackford Adults who Experienced Coronary Heart Disease
9.0%
(2021)
Compared to:
IN Counties
The distribution is based on data from 92 Indiana counties.
U.S. Counties
The distribution is based on data from 3,074 U.S. counties and county equivalents.
US Value
(6.1%)
The regional value is compared to the national value.
County: Blackford Adults who Have Taken Medications for High Blood Pressure
County: Blackford Adults who Have Taken Medications for High Blood Pressure
83.1%
(2021)
Compared to:
IN Counties
The distribution is based on data from 92 Indiana counties.
U.S. Counties
The distribution is based on data from 3,074 U.S. counties and county equivalents.
US Value
(78.2%)
The regional value is compared to the national value.
County: Blackford Age-Adjusted Death Rate due to Cerebrovascular Disease (Stroke)
County: Blackford Age-Adjusted Death Rate due to Cerebrovascular Disease (Stroke)
44.4
Deaths per 100,000 population
(2018-2020)
Compared to:
IN Counties
The distribution is based on data from 85 Indiana counties.
U.S. Counties
The distribution is based on data from 2,338 U.S. counties and county equivalents.
IN Value
(40.4)
The regional value is compared to the Indiana State value.
US Value
(37.6)
The regional value is compared to the national value.
Prior Value
(38.0)
Prior Value compares a measured value with the previously measured value. Confidence intervals were taken into account in determining the direction of the comparison.
Trend
This comparison measures the indicator’s values over multiple time periods.<br>The Mann-Kendall Test for Statistical Significance is used to evaluate the trend<br>over 4 to 10 periods of measure, subject to data availability and comparability.
HP 2030 Target
(33.4)
County: Blackford Age-Adjusted Death Rate due to Coronary Heart Disease
County: Blackford Age-Adjusted Death Rate due to Coronary Heart Disease
80.6
Deaths per 100,000 population
(2018-2020)
Compared to:
IN Counties
The distribution is based on data from 92 Indiana counties.
U.S. Counties
The distribution is based on data from 2,852 U.S. counties and county equivalents.
IN Value
(95.8)
The regional value is compared to the Indiana State value.
US Value
(90.2)
The regional value is compared to the national value.
Prior Value
(87.3)
Prior Value compares a measured value with the previously measured value. Confidence intervals were taken into account in determining the direction of the comparison.
Trend
This comparison measures the indicator’s values over multiple time periods.<br>The Mann-Kendall Test for Statistical Significance is used to evaluate the trend<br>over 4 to 10 periods of measure, subject to data availability and comparability.
HP 2030 Target
(71.1)
County: Blackford Age-Adjusted Death Rate due to Heart Attack
County: Blackford Age-Adjusted Death Rate due to Heart Attack
63.9
Deaths per 100,000 population 35+ years
(2016)
Compared to:
IN Counties
The distribution is based on data from 92 Indiana counties.
IN Value
(77.5)
The regional value is compared to the Indiana State value.
Prior Value
(62.6)
Prior Value compares a measured value with the previously measured value. Confidence intervals were not taken into account in determining the direction of the comparison.
Trend
This comparison measures the indicator’s values over multiple time periods.<br>The Mann-Kendall Test for Statistical Significance is used to evaluate the trend<br>over 4 to 10 periods of measure, subject to data availability and comparability.
County: Blackford Atrial Fibrillation: Medicare Population
County: Blackford Atrial Fibrillation: Medicare Population
16.0%
(2022)
Compared to:
IN Counties
The distribution is based on data from 92 Indiana counties.
U.S. Counties
The distribution is based on data from 3,129 U.S. counties and county equivalents.
IN Value
(14.0%)
The regional value is compared to the Indiana State value.
US Value
(14.0%)
The regional value is compared to the national value.
Prior Value
(14.0%)
Prior Value compares a measured value with the previously measured value. Confidence intervals were not taken into account in determining the direction of the comparison.
Trend
This comparison measures the indicator’s values over multiple time periods.<br>The Mann-Kendall Test for Statistical Significance is used to evaluate the trend<br>over 4 to 10 periods of measure, subject to data availability and comparability.
County: Blackford Cholesterol Test History
County: Blackford Cholesterol Test History
82.6%
(2021)
Compared to:
IN Counties
The distribution is based on data from 92 Indiana counties.
U.S. Counties
The distribution is based on data from 3,074 U.S. counties and county equivalents.
US Value
(86.4%)
The regional value is compared to the national value.
County: Blackford Heart Failure: Medicare Population
County: Blackford Heart Failure: Medicare Population
14.0%
(2022)
Compared to:
IN Counties
The distribution is based on data from 92 Indiana counties.
U.S. Counties
The distribution is based on data from 3,129 U.S. counties and county equivalents.
IN Value
(12.0%)
The regional value is compared to the Indiana State value.
US Value
(11.0%)
The regional value is compared to the national value.
Prior Value
(13.0%)
Prior Value compares a measured value with the previously measured value. Confidence intervals were not taken into account in determining the direction of the comparison.
Trend
This comparison measures the indicator’s values over multiple time periods.<br>The Mann-Kendall Test for Statistical Significance is used to evaluate the trend<br>over 4 to 10 periods of measure, subject to data availability and comparability.
County: Blackford High Blood Pressure Prevalence
County: Blackford High Blood Pressure Prevalence
41.8%
(2021)
Compared to:
IN Counties
The distribution is based on data from 92 Indiana counties.
U.S. Counties
The distribution is based on data from 3,074 U.S. counties and county equivalents.
US Value
(32.7%)
The regional value is compared to the national value.
HP 2030 Target
(41.9%)
County: Blackford High Cholesterol Prevalence: Past 5 Years
County: Blackford High Cholesterol Prevalence: Past 5 Years
40.3%
(2021)
Compared to:
IN Counties
The distribution is based on data from 92 Indiana counties.
U.S. Counties
The distribution is based on data from 3,074 U.S. counties and county equivalents.
US Value
(36.4%)
The regional value is compared to the national value.
County: Blackford Hyperlipidemia: Medicare Population
County: Blackford Hyperlipidemia: Medicare Population
64.0%
(2022)
Compared to:
IN Counties
The distribution is based on data from 92 Indiana counties.
U.S. Counties
The distribution is based on data from 3,129 U.S. counties and county equivalents.
IN Value
(66.0%)
The regional value is compared to the Indiana State value.
US Value
(65.0%)
The regional value is compared to the national value.
Prior Value
(60.0%)
Prior Value compares a measured value with the previously measured value. Confidence intervals were not taken into account in determining the direction of the comparison.
Trend
This comparison measures the indicator’s values over multiple time periods.<br>The Mann-Kendall Test for Statistical Significance is used to evaluate the trend<br>over 4 to 10 periods of measure, subject to data availability and comparability.
County: Blackford Hypertension: Medicare Population
County: Blackford Hypertension: Medicare Population
71.0%
(2022)
Compared to:
IN Counties
The distribution is based on data from 92 Indiana counties.
U.S. Counties
The distribution is based on data from 3,129 U.S. counties and county equivalents.
IN Value
(69.0%)
The regional value is compared to the Indiana State value.
US Value
(65.0%)
The regional value is compared to the national value.
Prior Value
(71.0%)
Prior Value compares a measured value with the previously measured value. Confidence intervals were not taken into account in determining the direction of the comparison.
Trend
This comparison measures the indicator’s values over multiple time periods.<br>The Mann-Kendall Test for Statistical Significance is used to evaluate the trend<br>over 4 to 10 periods of measure, subject to data availability and comparability.
County: Blackford Ischemic Heart Disease: Medicare Population
County: Blackford Ischemic Heart Disease: Medicare Population
20.0%
(2022)
Compared to:
IN Counties
The distribution is based on data from 92 Indiana counties.
U.S. Counties
The distribution is based on data from 3,129 U.S. counties and county equivalents.
IN Value
(22.0%)
The regional value is compared to the Indiana State value.
US Value
(21.0%)
The regional value is compared to the national value.
Prior Value
(20.0%)
Prior Value compares a measured value with the previously measured value. Confidence intervals were not taken into account in determining the direction of the comparison.
Trend
This comparison measures the indicator’s values over multiple time periods.<br>The Mann-Kendall Test for Statistical Significance is used to evaluate the trend<br>over 4 to 10 periods of measure, subject to data availability and comparability.
County: Blackford Stroke: Medicare Population
County: Blackford Stroke: Medicare Population
5.0%
(2022)
Compared to:
IN Counties
The distribution is based on data from 92 Indiana counties.
U.S. Counties
The distribution is based on data from 3,129 U.S. counties and county equivalents.
IN Value
(5.0%)
The regional value is compared to the Indiana State value.
US Value
(6.0%)
The regional value is compared to the national value.
Prior Value
(5.0%)
Prior Value compares a measured value with the previously measured value. Confidence intervals were not taken into account in determining the direction of the comparison.
Trend
This comparison measures the indicator’s values over multiple time periods.<br>The Mann-Kendall Test for Statistical Significance is used to evaluate the trend<br>over 4 to 10 periods of measure, subject to data availability and comparability.
County: Blackford
Health / Immunizations & Infectious Diseases
Value
Compared to:
County: Blackford COVID-19 Daily Average Case-Fatality Rate
County: Blackford COVID-19 Daily Average Case-Fatality Rate
0.0
Deaths per 100 cases
(Mar 3, 2023)
Compared to:
IN Counties
(Apr 1, 2022)
The distribution is based on data from 83 Indiana counties.
U.S. Counties
(Mar 25, 2022)
The distribution is based on data from 2,811 U.S. counties and county equivalents.
IN Value
(1.0)
The regional value is compared to the Indiana State value.
US Value
(1.7)
The regional value is compared to the national value.
Prior Value
(0.0)
Prior Value compares a measured value with the previously measured value. Confidence intervals were not taken into account in determining the direction of the comparison.
Trend
This comparison measures the indicator’s values over multiple time periods.<br>The Mann-Kendall Test for Statistical Significance is used to evaluate the trend<br>over 4 to 10 periods of measure, subject to data availability and comparability.
County: Blackford COVID-19 Daily Average Incidence Rate
County: Blackford COVID-19 Daily Average Incidence Rate
14.31
Cases per 100,000 population
(Mar 3, 2023)
Compared to:
IN Counties
The distribution is based on data from 92 Indiana counties.
U.S. Counties
The distribution is based on data from 3,142 U.S. counties and county equivalents.
IN Value
(10.60)
The regional value is compared to the Indiana State value.
US Value
(10.97)
The regional value is compared to the national value.
Prior Value
(10.73)
Prior Value compares a measured value with the previously measured value. Confidence intervals were not taken into account in determining the direction of the comparison.
Trend
This comparison measures the indicator’s values over multiple time periods.<br>The Mann-Kendall Test for Statistical Significance is used to evaluate the trend<br>over 4 to 10 periods of measure, subject to data availability and comparability.
County: Blackford Flu Vaccinations: Medicare Population
County: Blackford Flu Vaccinations: Medicare Population
40.0%
(2022)
Compared to:
IN Counties
The distribution is based on data from 92 Indiana counties.
U.S. Counties
The distribution is based on data from 3,129 U.S. counties and county equivalents.
IN Value
(54.0%)
The regional value is compared to the Indiana State value.
US Value
(50.0%)
The regional value is compared to the national value.
Prior Value
(39.0%)
Prior Value compares a measured value with the previously measured value. Confidence intervals were not taken into account in determining the direction of the comparison.
Trend
This comparison measures the indicator’s values over multiple time periods.<br>The Mann-Kendall Test for Statistical Significance is used to evaluate the trend<br>over 4 to 10 periods of measure, subject to data availability and comparability.
County: Blackford Hepatitis C Prevalence
County: Blackford Hepatitis C Prevalence
212.6
Rate per 100,000 population
(2019)
Compared to:
IN Counties
The distribution is based on data from 92 Indiana counties.
IN Value
(90.0)
The regional value is compared to the Indiana State value.
Prior Value
(226.3)
Prior Value compares a measured value with the previously measured value. Confidence intervals were not taken into account in determining the direction of the comparison.
Trend
This comparison measures the indicator’s values over multiple time periods.<br>The Mann-Kendall Test for Statistical Significance is used to evaluate the trend<br>over 4 to 10 periods of measure, subject to data availability and comparability.
County: Blackford Persons Fully Vaccinated Against COVID-19
County: Blackford Persons Fully Vaccinated Against COVID-19
50.0%
(May 10, 2023)
Compared to:
IN Counties
The distribution is based on data from 92 Indiana counties.
U.S. Counties
The distribution is based on data from 3,125 U.S. counties and county equivalents.
Prior Value
(49.9%)
Prior Value compares a measured value with the previously measured value. Confidence intervals were not taken into account in determining the direction of the comparison.
Trend
This comparison measures the indicator’s values over multiple time periods.<br>The Mann-Kendall Test for Statistical Significance is used to evaluate the trend<br>over 4 to 10 periods of measure, subject to data availability and comparability.
County: Blackford Pneumonia Vaccinations: Medicare Population
County: Blackford Pneumonia Vaccinations: Medicare Population
8.0%
(2022)
Compared to:
IN Counties
The distribution is based on data from 92 Indiana counties.
U.S. Counties
The distribution is based on data from 3,129 U.S. counties and county equivalents.
IN Value
(9.0%)
The regional value is compared to the Indiana State value.
US Value
(8.0%)
The regional value is compared to the national value.
Prior Value
(7.0%)
Prior Value compares a measured value with the previously measured value. Confidence intervals were not taken into account in determining the direction of the comparison.
Trend
This comparison measures the indicator’s values over multiple time periods.<br>The Mann-Kendall Test for Statistical Significance is used to evaluate the trend<br>over 4 to 10 periods of measure, subject to data availability and comparability.
County: Blackford
Health / Maternal, Fetal & Infant Health
Value
Compared to:
County: Blackford Mothers who Received Early Prenatal Care
County: Blackford Mothers who Received Early Prenatal Care
79.4%
(2021)
Compared to:
IN Counties
The distribution is based on data from 92 Indiana counties.
IN Value
(71.7%)
The regional value is compared to the Indiana State value.
US Value
(78.3%)
The regional value is compared to the national value. The source for the national value is Centers for Disease Control and Prevention
Prior Value
(84.0%)
Prior Value compares a measured value with the previously measured value. Confidence intervals were not taken into account in determining the direction of the comparison.
Trend
This comparison measures the indicator’s values over multiple time periods.<br>The Mann-Kendall Test for Statistical Significance is used to evaluate the trend<br>over 4 to 10 periods of measure, subject to data availability and comparability.
County: Blackford Mothers who Smoked During Pregnancy
County: Blackford Mothers who Smoked During Pregnancy
26.2%
(2021)
Compared to:
IN Counties
The distribution is based on data from 92 Indiana counties.
IN Value
(9.8%)
The regional value is compared to the Indiana State value.
US Value
(4.6%)
The regional value is compared to the national value. The source for the national value is Centers for Disease Control and Prevention
HP 2030 Target
(4.3%)
County: Blackford Preterm Births
County: Blackford Preterm Births
19.1%
(2014)
Compared to:
IN Counties
The distribution is based on data from 90 Indiana counties.
IN Value
(9.7%)
The regional value is compared to the Indiana State value.
US Value
(9.6%)
The regional value is compared to the national value. The source for the national value is Centers for Disease Control and Prevention
HP 2030 Target
(9.4%)
County: Blackford
Health / Mental Health & Mental Disorders
Value
Compared to:
County: Blackford Adults Ever Diagnosed with Depression
County: Blackford Adults Ever Diagnosed with Depression
25.4%
(2021)
Compared to:
IN Counties
The distribution is based on data from 92 Indiana counties.
U.S. Counties
The distribution is based on data from 3,074 U.S. counties and county equivalents.
US Value
(19.5%)
The regional value is compared to the national value.
County: Blackford Depression: Medicare Population
County: Blackford Depression: Medicare Population
16.0%
(2022)
Compared to:
IN Counties
The distribution is based on data from 92 Indiana counties.
U.S. Counties
The distribution is based on data from 3,129 U.S. counties and county equivalents.
IN Value
(17.0%)
The regional value is compared to the Indiana State value.
US Value
(16.0%)
The regional value is compared to the national value.
Prior Value
(15.0%)
Prior Value compares a measured value with the previously measured value. Confidence intervals were not taken into account in determining the direction of the comparison.
Trend
This comparison measures the indicator’s values over multiple time periods.<br>The Mann-Kendall Test for Statistical Significance is used to evaluate the trend<br>over 4 to 10 periods of measure, subject to data availability and comparability.
County: Blackford Frequent Mental Distress
County: Blackford Frequent Mental Distress
17.6%
(2019)
Compared to:
IN Counties
The distribution is based on data from 92 Indiana counties.
U.S. Counties
The distribution is based on data from 3,121 U.S. counties and county equivalents.
IN Value
(14.8%)
The regional value is compared to the Indiana State value.
US Value
(14.0%)
The regional value is compared to the national value.
Prior Value
(16.6%)
Prior Value compares a measured value with the previously measured value. Confidence intervals were taken into account in determining the direction of the comparison.
County: Blackford Mental Health Provider Rate
County: Blackford Mental Health Provider Rate
34
Providers per 100,000 population
(2023)
Compared to:
IN Counties
The distribution is based on data from 90 Indiana counties.
U.S. Counties
The distribution is based on data from 2,956 U.S. counties and county equivalents.
IN Value
(200)
The regional value is compared to the Indiana State value.
Prior Value
(33)
Prior Value compares a measured value with the previously measured value. Confidence intervals were not taken into account in determining the direction of the comparison.
Trend
This comparison measures the indicator’s values over multiple time periods.<br>The Mann-Kendall Test for Statistical Significance is used to evaluate the trend<br>over 4 to 10 periods of measure, subject to data availability and comparability.
County: Blackford Poor Mental Health: 14+ Days
County: Blackford Poor Mental Health: 14+ Days
17.1%
(2021)
Compared to:
IN Counties
The distribution is based on data from 92 Indiana counties.
U.S. Counties
The distribution is based on data from 3,074 U.S. counties and county equivalents.
US Value
(14.7%)
The regional value is compared to the national value.
County: Blackford Poor Mental Health: Average Number of Days
County: Blackford Poor Mental Health: Average Number of Days
5.7
Days
(2021)
Compared to:
IN Counties
The distribution is based on data from 92 Indiana counties.
U.S. Counties
The distribution is based on data from 3,141 U.S. counties and county equivalents.
IN Value
(5.2)
The regional value is compared to the Indiana State value.
US Value
(4.8)
The regional value is compared to the national value.
Prior Value
(5.1)
Prior Value compares a measured value with the previously measured value. Confidence intervals were taken into account in determining the direction of the comparison.
Trend
This comparison measures the indicator’s values over multiple time periods.<br>The Mann-Kendall Test for Statistical Significance is used to evaluate the trend<br>over 4 to 10 periods of measure, subject to data availability and comparability.
County: Blackford
Health / Mortality Data
Value
Compared to:
County: Blackford Life Expectancy
County: Blackford Life Expectancy
73.0
Years
(2019-2021)
Compared to:
IN Counties
The distribution is based on data from 92 Indiana counties.
U.S. Counties
The distribution is based on data from 3,070 U.S. counties and county equivalents.
IN Value
(75.6)
The regional value is compared to the Indiana State value.
US Value
(77.6)
The regional value is compared to the national value.
County: Blackford
Health / Older Adults
Value
Compared to:
County: Blackford Adults 65+ who Received Recommended Preventive Services: Females
County: Blackford Adults 65+ who Received Recommended Preventive Services: Females
33.4%
(2020)
Compared to:
IN Counties
The distribution is based on data from 92 Indiana counties.
U.S. Counties
The distribution is based on data from 3,141 U.S. counties and county equivalents.
US Value
(37.9%)
The regional value is compared to the national value.
County: Blackford Adults 65+ who Received Recommended Preventive Services: Males
County: Blackford Adults 65+ who Received Recommended Preventive Services: Males
41.1%
(2020)
Compared to:
IN Counties
The distribution is based on data from 92 Indiana counties.
U.S. Counties
The distribution is based on data from 3,141 U.S. counties and county equivalents.
US Value
(43.7%)
The regional value is compared to the national value.
County: Blackford Adults 65+ with a Disability
County: Blackford Adults 65+ with a Disability
35.6%
(2018-2022)
Compared to:

IN Value
(33.8%)
The regional value is compared to the Indiana State value.
US Value
(33.3%)
The regional value is compared to the national value.
Trend
This comparison measures the indicator’s values over multiple time periods.<br>The Mann-Kendall Test for Statistical Significance is used to evaluate the trend<br>over 4 to 10 periods of measure, subject to data availability and comparability.
County: Blackford Adults 65+ with a Hearing Difficulty
County: Blackford Adults 65+ with a Hearing Difficulty
17.4%
(2018-2022)
Compared to:
IN Value
(14.4%)
The regional value is compared to the Indiana State value.
US Value
(13.7%)
The regional value is compared to the national value.
Trend
This comparison measures the indicator’s values over multiple time periods.<br>The Mann-Kendall Test for Statistical Significance is used to evaluate the trend<br>over 4 to 10 periods of measure, subject to data availability and comparability.
County: Blackford Adults 65+ with a Self-Care Difficulty
County: Blackford Adults 65+ with a Self-Care Difficulty
7.7%
(2018-2022)
Compared to:

IN Value
(6.6%)
The regional value is compared to the Indiana State value.
US Value
(7.4%)
The regional value is compared to the national value.
Trend
This comparison measures the indicator’s values over multiple time periods.<br>The Mann-Kendall Test for Statistical Significance is used to evaluate the trend<br>over 4 to 10 periods of measure, subject to data availability and comparability.
County: Blackford Adults 65+ with a Vision Difficulty
County: Blackford Adults 65+ with a Vision Difficulty
10.7%
(2018-2022)
Compared to:
IN Value
(6.1%)
The regional value is compared to the Indiana State value.
US Value
(6.0%)
The regional value is compared to the national value.
Trend
This comparison measures the indicator’s values over multiple time periods.<br>The Mann-Kendall Test for Statistical Significance is used to evaluate the trend<br>over 4 to 10 periods of measure, subject to data availability and comparability.
County: Blackford Adults 65+ with an Independent Living Difficulty
County: Blackford Adults 65+ with an Independent Living Difficulty
15.8%
(2018-2022)
Compared to:
IN Value
(12.4%)
The regional value is compared to the Indiana State value.
US Value
(13.6%)
The regional value is compared to the national value.
Trend
This comparison measures the indicator’s values over multiple time periods.<br>The Mann-Kendall Test for Statistical Significance is used to evaluate the trend<br>over 4 to 10 periods of measure, subject to data availability and comparability.
County: Blackford Age-Adjusted Death Rate due to Alzheimer's Disease
County: Blackford Age-Adjusted Death Rate due to Alzheimer's Disease
35.8
Deaths per 100,000 population
(2015-2017)
Compared to:
IN Counties
The distribution is based on data from 77 Indiana counties.
U.S. Counties
The distribution is based on data from 2,055 U.S. counties and county equivalents.
IN Value
(34.4)
The regional value is compared to the Indiana State value.
US Value
(30.3)
The regional value is compared to the national value.
Prior Value
(38.1)
Prior Value compares a measured value with the previously measured value. Confidence intervals were taken into account in determining the direction of the comparison.
Trend
This comparison measures the indicator’s values over multiple time periods.<br>The Mann-Kendall Test for Statistical Significance is used to evaluate the trend<br>over 4 to 10 periods of measure, subject to data availability and comparability.
County: Blackford Alzheimer's Disease or Dementia: Medicare Population
County: Blackford Alzheimer's Disease or Dementia: Medicare Population
4.0%
(2022)
Compared to:
IN Counties
The distribution is based on data from 92 Indiana counties.
U.S. Counties
The distribution is based on data from 3,129 U.S. counties and county equivalents.
IN Value
(5.0%)
The regional value is compared to the Indiana State value.
US Value
(6.0%)
The regional value is compared to the national value.
Prior Value
(4.0%)
Prior Value compares a measured value with the previously measured value. Confidence intervals were not taken into account in determining the direction of the comparison.
Trend
This comparison measures the indicator’s values over multiple time periods.<br>The Mann-Kendall Test for Statistical Significance is used to evaluate the trend<br>over 4 to 10 periods of measure, subject to data availability and comparability.
County: Blackford
Health / Oral Health
Value
Compared to:
County: Blackford Adults 65+ with Total Tooth Loss
County: Blackford Adults 65+ with Total Tooth Loss
15.7%
(2020)
Compared to:
IN Counties
The distribution is based on data from 92 Indiana counties.
U.S. Counties
The distribution is based on data from 3,141 U.S. counties and county equivalents.
US Value
(13.4%)
The regional value is compared to the national value.
County: Blackford Adults who Visited a Dentist
County: Blackford Adults who Visited a Dentist
56.9%
(2020)
Compared to:
IN Counties
The distribution is based on data from 92 Indiana counties.
U.S. Counties
The distribution is based on data from 3,141 U.S. counties and county equivalents.
US Value
(64.8%)
The regional value is compared to the national value.
County: Blackford Dentist Rate
County: Blackford Dentist Rate
17
Dentists per 100,000 population
(2022)
Compared to:
IN Counties
The distribution is based on data from 90 Indiana counties.
U.S. Counties
The distribution is based on data from 3,054 U.S. counties and county equivalents.
IN Value
(60)
The regional value is compared to the Indiana State value.
Prior Value
(25)
Prior Value compares a measured value with the previously measured value. Confidence intervals were not taken into account in determining the direction of the comparison.
Trend
This comparison measures the indicator’s values over multiple time periods.<br>The Mann-Kendall Test for Statistical Significance is used to evaluate the trend<br>over 4 to 10 periods of measure, subject to data availability and comparability.
County: Blackford
Health / Other Conditions
Value
Compared to:
County: Blackford Adults with Arthritis
County: Blackford Adults with Arthritis
34.8%
(2021)
Compared to:
IN Counties
The distribution is based on data from 92 Indiana counties.
U.S. Counties
The distribution is based on data from 3,074 U.S. counties and county equivalents.
US Value
(25.2%)
The regional value is compared to the national value.
County: Blackford Adults with Kidney Disease
County: Blackford Adults with Kidney Disease
3.9%
(2021)
Compared to:
IN Counties
The distribution is based on data from 92 Indiana counties.
U.S. Counties
The distribution is based on data from 3,074 U.S. counties and county equivalents.
US Value
(3.1%)
The regional value is compared to the national value.
County: Blackford Age-Adjusted Death Rate due to Kidney Disease
County: Blackford Age-Adjusted Death Rate due to Kidney Disease
39.9
Deaths per 100,000 population
(2008-2010)
Compared to:
IN Counties
The distribution is based on data from 53 Indiana counties.
U.S. Counties
The distribution is based on data from 1,397 U.S. counties and county equivalents.
IN Value
(21.1)
The regional value is compared to the Indiana State value.
US Value
(15.2)
The regional value is compared to the national value.
County: Blackford Chronic Kidney Disease: Medicare Population
County: Blackford Chronic Kidney Disease: Medicare Population
19.0%
(2022)
Compared to:
IN Counties
The distribution is based on data from 92 Indiana counties.
U.S. Counties
The distribution is based on data from 3,129 U.S. counties and county equivalents.
IN Value
(18.0%)
The regional value is compared to the Indiana State value.
US Value
(18.0%)
The regional value is compared to the national value.
Prior Value
(18.0%)
Prior Value compares a measured value with the previously measured value. Confidence intervals were not taken into account in determining the direction of the comparison.
Trend
This comparison measures the indicator’s values over multiple time periods.<br>The Mann-Kendall Test for Statistical Significance is used to evaluate the trend<br>over 4 to 10 periods of measure, subject to data availability and comparability.
County: Blackford Osteoporosis: Medicare Population
County: Blackford Osteoporosis: Medicare Population
8.0%
(2022)
Compared to:
IN Counties
The distribution is based on data from 92 Indiana counties.
U.S. Counties
The distribution is based on data from 3,129 U.S. counties and county equivalents.
IN Value
(11.0%)
The regional value is compared to the Indiana State value.
US Value
(11.0%)
The regional value is compared to the national value.
Prior Value
(8.0%)
Prior Value compares a measured value with the previously measured value. Confidence intervals were not taken into account in determining the direction of the comparison.
Trend
This comparison measures the indicator’s values over multiple time periods.<br>The Mann-Kendall Test for Statistical Significance is used to evaluate the trend<br>over 4 to 10 periods of measure, subject to data availability and comparability.
County: Blackford Rheumatoid Arthritis or Osteoarthritis: Medicare Population
County: Blackford Rheumatoid Arthritis or Osteoarthritis: Medicare Population
38.0%
(2022)
Compared to:
IN Counties
The distribution is based on data from 92 Indiana counties.
U.S. Counties
The distribution is based on data from 3,129 U.S. counties and county equivalents.
IN Value
(35.0%)
The regional value is compared to the Indiana State value.
US Value
(35.0%)
The regional value is compared to the national value.
Prior Value
(34.0%)
Prior Value compares a measured value with the previously measured value. Confidence intervals were not taken into account in determining the direction of the comparison.
Trend
This comparison measures the indicator’s values over multiple time periods.<br>The Mann-Kendall Test for Statistical Significance is used to evaluate the trend<br>over 4 to 10 periods of measure, subject to data availability and comparability.
County: Blackford
Health / Physical Activity
Value
Compared to:
County: Blackford Adults 20+ who are Sedentary
County: Blackford Adults 20+ who are Sedentary
22.9%
(2021)
Compared to:
IN Counties
The distribution is based on data from 92 Indiana counties.
U.S. Counties
The distribution is based on data from 3,074 U.S. counties and county equivalents.
Prior Value
(18.0%)
Prior Value compares a measured value with the previously measured value. Confidence intervals were taken into account in determining the direction of the comparison.
Trend
This comparison measures the indicator’s values over multiple time periods.<br>The Mann-Kendall Test for Statistical Significance is used to evaluate the trend<br>over 4 to 10 periods of measure, subject to data availability and comparability.
County: Blackford
Health / Prevention & Safety
Value
Compared to:
County: Blackford Age-Adjusted Death Rate due to Unintentional Injuries
County: Blackford Age-Adjusted Death Rate due to Unintentional Injuries
67.4
Deaths per 100,000 population
(2018-2020)
Compared to:
IN Counties
The distribution is based on data from 84 Indiana counties.
U.S. Counties
The distribution is based on data from 2,454 U.S. counties and county equivalents.
IN Value
(59.4)
The regional value is compared to the Indiana State value.
US Value
(51.6)
The regional value is compared to the national value.
Prior Value
(81.0)
Prior Value compares a measured value with the previously measured value. Confidence intervals were taken into account in determining the direction of the comparison.
Trend
This comparison measures the indicator’s values over multiple time periods.<br>The Mann-Kendall Test for Statistical Significance is used to evaluate the trend<br>over 4 to 10 periods of measure, subject to data availability and comparability.
HP 2030 Target
(43.2)
County: Blackford
Health / Respiratory Diseases
Value
Compared to:
County: Blackford Adults with COPD
County: Blackford Adults with COPD
11.7%
Percent of adults
(2021)
Compared to:
IN Counties
The distribution is based on data from 92 Indiana counties.
U.S. Counties
The distribution is based on data from 3,074 U.S. counties and county equivalents.
US Value
(6.4%)
The regional value is compared to the national value.
County: Blackford Adults with Current Asthma
County: Blackford Adults with Current Asthma
10.9%
(2021)
Compared to:
IN Counties
The distribution is based on data from 92 Indiana counties.
U.S. Counties
The distribution is based on data from 3,074 U.S. counties and county equivalents.
US Value
(9.7%)
The regional value is compared to the national value.
County: Blackford Age-Adjusted Death Rate due to Chronic Lower Respiratory Diseases
County: Blackford Age-Adjusted Death Rate due to Chronic Lower Respiratory Diseases
75.7
Deaths per 100,000 population
(2018-2020)
Compared to:
IN Counties
The distribution is based on data from 90 Indiana counties.
U.S. Counties
The distribution is based on data from 2,518 U.S. counties and county equivalents.
IN Value
(55.6)
The regional value is compared to the Indiana State value.
US Value
(38.1)
The regional value is compared to the national value.
Prior Value
(76.3)
Prior Value compares a measured value with the previously measured value. Confidence intervals were taken into account in determining the direction of the comparison.
Trend
This comparison measures the indicator’s values over multiple time periods.<br>The Mann-Kendall Test for Statistical Significance is used to evaluate the trend<br>over 4 to 10 periods of measure, subject to data availability and comparability.
County: Blackford Asthma: Medicare Population
County: Blackford Asthma: Medicare Population
6.0%
(2022)
Compared to:
IN Counties
The distribution is based on data from 92 Indiana counties.
U.S. Counties
The distribution is based on data from 3,129 U.S. counties and county equivalents.
IN Value
(6.0%)
The regional value is compared to the Indiana State value.
US Value
(7.0%)
The regional value is compared to the national value.
Prior Value
(6.0%)
Prior Value compares a measured value with the previously measured value. Confidence intervals were not taken into account in determining the direction of the comparison.
Trend
This comparison measures the indicator’s values over multiple time periods.<br>The Mann-Kendall Test for Statistical Significance is used to evaluate the trend<br>over 4 to 10 periods of measure, subject to data availability and comparability.
County: Blackford COPD: Medicare Population
County: Blackford COPD: Medicare Population
15.0%
(2022)
Compared to:
IN Counties
The distribution is based on data from 92 Indiana counties.
U.S. Counties
The distribution is based on data from 3,129 U.S. counties and county equivalents.
IN Value
(13.0%)
The regional value is compared to the Indiana State value.
US Value
(11.0%)
The regional value is compared to the national value.
Prior Value
(14.0%)
Prior Value compares a measured value with the previously measured value. Confidence intervals were not taken into account in determining the direction of the comparison.
Trend
This comparison measures the indicator’s values over multiple time periods.<br>The Mann-Kendall Test for Statistical Significance is used to evaluate the trend<br>over 4 to 10 periods of measure, subject to data availability and comparability.
County: Blackford
Health / Sexually Transmitted Infections
Value
Compared to:
County: Blackford Chlamydia Incidence Rate
County: Blackford Chlamydia Incidence Rate
206.8
Cases per 100,000 population
(2021)
Compared to:
IN Counties
The distribution is based on data from 92 Indiana counties.
U.S. Counties
The distribution is based on data from 2,800 U.S. counties and county equivalents.
IN Value
(510.7)
The regional value is compared to the Indiana State value.
US Value
(495.5)
The regional value is compared to the national value.
Prior Value
(399.7)
Prior Value compares a measured value with the previously measured value. Confidence intervals were not taken into account in determining the direction of the comparison.
Trend
This comparison measures the indicator’s values over multiple time periods.<br>The Mann-Kendall Test for Statistical Significance is used to evaluate the trend<br>over 4 to 10 periods of measure, subject to data availability and comparability.
County: Blackford Gonorrhea Incidence Rate
County: Blackford Gonorrhea Incidence Rate
74.4
Cases per 100,000 population
(2021)
Compared to:
IN Counties
The distribution is based on data from 92 Indiana counties.
U.S. Counties
The distribution is based on data from 3,117 U.S. counties and county equivalents.
IN Value
(212.8)
The regional value is compared to the Indiana State value.
US Value
(214.0)
The regional value is compared to the national value.
Prior Value
(144.6)
Prior Value compares a measured value with the previously measured value. Confidence intervals were not taken into account in determining the direction of the comparison.
Trend
This comparison measures the indicator’s values over multiple time periods.<br>The Mann-Kendall Test for Statistical Significance is used to evaluate the trend<br>over 4 to 10 periods of measure, subject to data availability and comparability.
County: Blackford HIV Prevalence Rate
County: Blackford HIV Prevalence Rate
70.4
Cases per 100,000 population
(2020)
Compared to:

IN Value
(210.5)
The regional value is compared to the Indiana State value.
US Value
(379.7)
The regional value is compared to the national value.
Prior Value
(150.3)
Prior Value compares a measured value with the previously measured value. Confidence intervals were not taken into account in determining the direction of the comparison.
Trend
This comparison measures the indicator’s values over multiple time periods.<br>The Mann-Kendall Test for Statistical Significance is used to evaluate the trend<br>over 4 to 10 periods of measure, subject to data availability and comparability.
County: Blackford
Health / Tobacco Use
Value
Compared to:
County: Blackford Adults who Smoke
County: Blackford Adults who Smoke
22.7%
(2021)
Compared to:
IN Counties
The distribution is based on data from 92 Indiana counties.
U.S. Counties
The distribution is based on data from 3,074 U.S. counties and county equivalents.
US Value
(13.5%)
The regional value is compared to the national value.
HP 2030 Target
(6.1%)
<div>TU-02: Reduce current cigarette smoking in adults <strong>(LEADING HEALTH INDICATOR)</strong></div>
County: Blackford
Health / Weight Status
Value
Compared to:
County: Blackford Adults 20+ Who Are Obese
County: Blackford Adults 20+ Who Are Obese
24.4%
(2021)
Compared to:
IN Counties
The distribution is based on data from 92 Indiana counties.
U.S. Counties
The distribution is based on data from 3,074 U.S. counties and county equivalents.
Prior Value
(28.9%)
Prior Value compares a measured value with the previously measured value. Confidence intervals were taken into account in determining the direction of the comparison.
Trend
This comparison measures the indicator’s values over multiple time periods.<br>The Mann-Kendall Test for Statistical Significance is used to evaluate the trend<br>over 4 to 10 periods of measure, subject to data availability and comparability.
HP 2030 Target
(36.0%)
County: Blackford
Health / Wellness & Lifestyle
Value
Compared to:
County: Blackford Frequent Physical Distress
County: Blackford Frequent Physical Distress
15.0%
(2019)
Compared to:
IN Counties
The distribution is based on data from 92 Indiana counties.
U.S. Counties
The distribution is based on data from 3,121 U.S. counties and county equivalents.
IN Value
(13.0%)
The regional value is compared to the Indiana State value.
US Value
(12.0%)
The regional value is compared to the national value.
Prior Value
(14.0%)
Prior Value compares a measured value with the previously measured value. Confidence intervals were taken into account in determining the direction of the comparison.
County: Blackford Insufficient Sleep
County: Blackford Insufficient Sleep
36.6%
(2020)
Compared to:
IN Counties
The distribution is based on data from 92 Indiana counties.
U.S. Counties
The distribution is based on data from 3,140 U.S. counties and county equivalents.
IN Value
(35.9%)
The regional value is compared to the Indiana State value.
US Value
(33.0%)
The regional value is compared to the national value.
Prior Value
(37.7%)
Prior Value compares a measured value with the previously measured value. Confidence intervals were not taken into account in determining the direction of the comparison.
HP 2030 Target
(26.7%)
County: Blackford Poor Physical Health: 14+ Days
County: Blackford Poor Physical Health: 14+ Days
15.2%
(2021)
Compared to:
IN Counties
The distribution is based on data from 92 Indiana counties.
U.S. Counties
The distribution is based on data from 3,074 U.S. counties and county equivalents.
US Value
(10.9%)
The regional value is compared to the national value.
County: Blackford Poor Physical Health: Average Number of Days
County: Blackford Poor Physical Health: Average Number of Days
4.5
Days
(2021)
Compared to:
IN Counties
The distribution is based on data from 92 Indiana counties.
U.S. Counties
The distribution is based on data from 3,141 U.S. counties and county equivalents.
IN Value
(3.5)
The regional value is compared to the Indiana State value.
US Value
(3.3)
The regional value is compared to the national value.
Prior Value
(3.8)
Prior Value compares a measured value with the previously measured value. Confidence intervals were taken into account in determining the direction of the comparison.
Trend
This comparison measures the indicator’s values over multiple time periods.<br>The Mann-Kendall Test for Statistical Significance is used to evaluate the trend<br>over 4 to 10 periods of measure, subject to data availability and comparability.
County: Blackford Self-Reported General Health Assessment: Poor or Fair
County: Blackford Self-Reported General Health Assessment: Poor or Fair
22.0%
(2021)
Compared to:
IN Counties
The distribution is based on data from 92 Indiana counties.
U.S. Counties
The distribution is based on data from 3,074 U.S. counties and county equivalents.
US Value
(16.1%)
The regional value is compared to the national value.
County: Blackford
Community / Civic Engagement
Value
Compared to:
County: Blackford Voter Turnout: Presidential Election
County: Blackford Voter Turnout: Presidential Election
66%
(2020)
Compared to:
IN Counties
The distribution is based on data from 92 Indiana counties.
IN Value
(65%)
The regional value is compared to the Indiana State value.
Prior Value
(56%)
Prior Value compares a measured value with the previously measured value. Confidence intervals were not taken into account in determining the direction of the comparison.
Trend
This comparison measures the indicator’s values over multiple time periods.<br>The Mann-Kendall Test for Statistical Significance is used to evaluate the trend<br>over 4 to 10 periods of measure, subject to data availability and comparability.
HP 2030 Target
(58.4%)
<div>SDOH-07: Increase the proportion of the voting-age citizens who vote</div>
County: Blackford
Community / Crime & Crime Prevention
Value
Compared to:
County: Blackford Adults Admitted into Correctional Facilities
County: Blackford Adults Admitted into Correctional Facilities
34
Adults
(2022)
Compared to:
Prior Value
(25)
Prior Value compares a measured value with the previously measured value. Confidence intervals were not taken into account in determining the direction of the comparison.
Trend
This comparison measures the indicator’s values over multiple time periods.<br>The Mann-Kendall Test for Statistical Significance is used to evaluate the trend<br>over 4 to 10 periods of measure, subject to data availability and comparability.
County: Blackford Average Daily Jail Population
County: Blackford Average Daily Jail Population
3
Offenders
(2022)
Compared to:
Prior Value
(3)
Prior Value compares a measured value with the previously measured value. Confidence intervals were not taken into account in determining the direction of the comparison.
Trend
This comparison measures the indicator’s values over multiple time periods.<br>The Mann-Kendall Test for Statistical Significance is used to evaluate the trend<br>over 4 to 10 periods of measure, subject to data availability and comparability.
County: Blackford Juveniles Admitted into Correctional Facilities
County: Blackford Juveniles Admitted into Correctional Facilities
0
Juveniles
(2022)
Compared to:
Prior Value
Prior Value compares a measured value with the previously measured value. Confidence intervals were not taken into account in determining the direction of the comparison.
Trend
This comparison measures the indicator’s values over multiple time periods.<br>The Mann-Kendall Test for Statistical Significance is used to evaluate the trend<br>over 4 to 10 periods of measure, subject to data availability and comparability.
County: Blackford
Community / Demographics
Value
Compared to:
County: Blackford Average Household Size
County: Blackford Average Household Size
2.40
Persons per household
(2018-2022)
Compared to:
IN Value
(2.50)
The regional value is compared to the Indiana State value.
US Value
(2.60)
The regional value is compared to the national value.
Trend
This comparison measures the indicator’s values over multiple time periods.<br>The Mann-Kendall Test for Statistical Significance is used to evaluate the trend<br>over 4 to 10 periods of measure, subject to data availability and comparability.
County: Blackford Female Population
County: Blackford Female Population
50.8%
(2022)
Compared to:
IN Value
(50.3%)
The regional value is compared to the Indiana State value.
US Value
(50.4%)
The regional value is compared to the national value.
Prior Value
(50.8%)
Prior Value compares a measured value with the previously measured value. Confidence intervals were not taken into account in determining the direction of the comparison.
Trend
This comparison measures the indicator’s values over multiple time periods.<br>The Mann-Kendall Test for Statistical Significance is used to evaluate the trend<br>over 4 to 10 periods of measure, subject to data availability and comparability.
County: Blackford Foreign Born Persons
County: Blackford Foreign Born Persons
0.8%
(2018-2022)
Compared to:
IN Value
(5.6%)
The regional value is compared to the Indiana State value.
US Value
(13.7%)
The regional value is compared to the national value.
Trend
This comparison measures the indicator’s values over multiple time periods.<br>The Mann-Kendall Test for Statistical Significance is used to evaluate the trend<br>over 4 to 10 periods of measure, subject to data availability and comparability.
County: Blackford Households
County: Blackford Households
4,980
Households
(2018-2022)
Compared to:
Trend
This comparison measures the indicator’s values over multiple time periods.<br>The Mann-Kendall Test for Statistical Significance is used to evaluate the trend<br>over 4 to 10 periods of measure, subject to data availability and comparability.
County: Blackford Male Population
County: Blackford Male Population
49.2%
(2022)
Compared to:
IN Value
(49.7%)
The regional value is compared to the Indiana State value.
US Value
(49.6%)
The regional value is compared to the national value.
Prior Value
(49.2%)
Prior Value compares a measured value with the previously measured value. Confidence intervals were not taken into account in determining the direction of the comparison.
Trend
This comparison measures the indicator’s values over multiple time periods.<br>The Mann-Kendall Test for Statistical Significance is used to evaluate the trend<br>over 4 to 10 periods of measure, subject to data availability and comparability.
County: Blackford Population Age 5+ with Language Other than English Spoken at Home
County: Blackford Population Age 5+ with Language Other than English Spoken at Home
1.1%
(2018-2022)
Compared to:
IN Value
(9.2%)
The regional value is compared to the Indiana State value.
US Value
(21.7%)
The regional value is compared to the national value.
County: Blackford Population American Indian and Alaska Native
County: Blackford Population American Indian and Alaska Native
0.4%
(2022)
Compared to:
IN Value
(0.4%)
The regional value is compared to the Indiana State value.
US Value
(1.3%)
The regional value is compared to the national value.
Prior Value
(0.3%)
Prior Value compares a measured value with the previously measured value. Confidence intervals were not taken into account in determining the direction of the comparison.
Trend
This comparison measures the indicator’s values over multiple time periods.<br>The Mann-Kendall Test for Statistical Significance is used to evaluate the trend<br>over 4 to 10 periods of measure, subject to data availability and comparability.
County: Blackford Population Asian
County: Blackford Population Asian
0.6%
(2022)
Compared to:
IN Value
(2.8%)
The regional value is compared to the Indiana State value.
US Value
(6.3%)
The regional value is compared to the national value.
Prior Value
(0.6%)
Prior Value compares a measured value with the previously measured value. Confidence intervals were not taken into account in determining the direction of the comparison.
Trend
This comparison measures the indicator’s values over multiple time periods.<br>The Mann-Kendall Test for Statistical Significance is used to evaluate the trend<br>over 4 to 10 periods of measure, subject to data availability and comparability.
County: Blackford Population Black or African American
County: Blackford Population Black or African American
1.1%
(2022)
Compared to:
IN Value
(10.3%)
The regional value is compared to the Indiana State value.
US Value
(13.6%)
The regional value is compared to the national value.
Prior Value
(0.9%)
Prior Value compares a measured value with the previously measured value. Confidence intervals were not taken into account in determining the direction of the comparison.
Trend
This comparison measures the indicator’s values over multiple time periods.<br>The Mann-Kendall Test for Statistical Significance is used to evaluate the trend<br>over 4 to 10 periods of measure, subject to data availability and comparability.
County: Blackford Population Hispanic or Latino
County: Blackford Population Hispanic or Latino
2.2%
(2022)
Compared to:
IN Value
(7.9%)
The regional value is compared to the Indiana State value.
US Value
(19.1%)
The regional value is compared to the national value.
Prior Value
(2.0%)
Prior Value compares a measured value with the previously measured value. Confidence intervals were not taken into account in determining the direction of the comparison.
Trend
This comparison measures the indicator’s values over multiple time periods.<br>The Mann-Kendall Test for Statistical Significance is used to evaluate the trend<br>over 4 to 10 periods of measure, subject to data availability and comparability.
County: Blackford Population Native Hawaiian and Other Pacific Islander
County: Blackford Population Native Hawaiian and Other Pacific Islander
0.0%
(2022)
Compared to:
IN Value
(0.1%)
The regional value is compared to the Indiana State value.
US Value
(0.3%)
The regional value is compared to the national value.
Prior Value
(0.0%)
Prior Value compares a measured value with the previously measured value. Confidence intervals were not taken into account in determining the direction of the comparison.
Trend
This comparison measures the indicator’s values over multiple time periods.<br>The Mann-Kendall Test for Statistical Significance is used to evaluate the trend<br>over 4 to 10 periods of measure, subject to data availability and comparability.
County: Blackford Population Over Age 65
County: Blackford Population Over Age 65
22.0%
(2022)
Compared to:
IN Value
(16.9%)
The regional value is compared to the Indiana State value.
US Value
(17.3%)
The regional value is compared to the national value.
Prior Value
(21.9%)
Prior Value compares a measured value with the previously measured value. Confidence intervals were not taken into account in determining the direction of the comparison.
Trend
This comparison measures the indicator’s values over multiple time periods.<br>The Mann-Kendall Test for Statistical Significance is used to evaluate the trend<br>over 4 to 10 periods of measure, subject to data availability and comparability.
County: Blackford Population Over Age 65 (Count)
County: Blackford Population Over Age 65 (Count)
2,587
People
(2018-2022)
Compared to:
Trend
This comparison measures the indicator’s values over multiple time periods.<br>The Mann-Kendall Test for Statistical Significance is used to evaluate the trend<br>over 4 to 10 periods of measure, subject to data availability and comparability.
County: Blackford Population Two or More Races
County: Blackford Population Two or More Races
2.2%
(2022)
Compared to:
IN Value
(2.4%)
The regional value is compared to the Indiana State value.
US Value
(3.0%)
The regional value is compared to the national value.
Prior Value
(1.8%)
Prior Value compares a measured value with the previously measured value. Confidence intervals were not taken into account in determining the direction of the comparison.
Trend
This comparison measures the indicator’s values over multiple time periods.<br>The Mann-Kendall Test for Statistical Significance is used to evaluate the trend<br>over 4 to 10 periods of measure, subject to data availability and comparability.
County: Blackford Population Under Age 18
County: Blackford Population Under Age 18
22.1%
(2022)
Compared to:
IN Value
(23.0%)
The regional value is compared to the Indiana State value.
US Value
(21.7%)
The regional value is compared to the national value.
Prior Value
(22.0%)
Prior Value compares a measured value with the previously measured value. Confidence intervals were not taken into account in determining the direction of the comparison.
Trend
This comparison measures the indicator’s values over multiple time periods.<br>The Mann-Kendall Test for Statistical Significance is used to evaluate the trend<br>over 4 to 10 periods of measure, subject to data availability and comparability.
County: Blackford Population Under Age 5
County: Blackford Population Under Age 5
5.6%
(2022)
Compared to:
IN Value
(5.9%)
The regional value is compared to the Indiana State value.
US Value
(5.6%)
The regional value is compared to the national value.
Prior Value
(5.6%)
Prior Value compares a measured value with the previously measured value. Confidence intervals were not taken into account in determining the direction of the comparison.
Trend
This comparison measures the indicator’s values over multiple time periods.<br>The Mann-Kendall Test for Statistical Significance is used to evaluate the trend<br>over 4 to 10 periods of measure, subject to data availability and comparability.
County: Blackford Population White
County: Blackford Population White
95.7%
(2022)
Compared to:
IN Value
(84.0%)
The regional value is compared to the Indiana State value.
US Value
(75.5%)
The regional value is compared to the national value.
Prior Value
(96.4%)
Prior Value compares a measured value with the previously measured value. Confidence intervals were not taken into account in determining the direction of the comparison.
Trend
This comparison measures the indicator’s values over multiple time periods.<br>The Mann-Kendall Test for Statistical Significance is used to evaluate the trend<br>over 4 to 10 periods of measure, subject to data availability and comparability.
County: Blackford Population White (Not Hispanic or Latino)
County: Blackford Population White (Not Hispanic or Latino)
93.8%
(2022)
Compared to:
IN Value
(77.0%)
The regional value is compared to the Indiana State value.
US Value
(58.9%)
The regional value is compared to the national value.
Prior Value
(94.7%)
Prior Value compares a measured value with the previously measured value. Confidence intervals were not taken into account in determining the direction of the comparison.
Trend
This comparison measures the indicator’s values over multiple time periods.<br>The Mann-Kendall Test for Statistical Significance is used to evaluate the trend<br>over 4 to 10 periods of measure, subject to data availability and comparability.
County: Blackford Residential Segregation - Black/White
County: Blackford Residential Segregation - Black/White
51.0
Score
(2024)
Compared to:
IN Counties
The distribution is based on data from 54 Indiana counties.
U.S. Counties
The distribution is based on data from 2,076 U.S. counties and county equivalents.
IN Value
(68.3)
The regional value is compared to the Indiana State value.
US Value
(62.7)
The regional value is compared to the national value.
County: Blackford Total Population
County: Blackford Total Population
11,893
People
(2023)
Compared to:
Prior Value
(11,919)
Prior Value compares a measured value with the previously measured value. Confidence intervals were not taken into account in determining the direction of the comparison.
Trend
This comparison measures the indicator’s values over multiple time periods.<br>The Mann-Kendall Test for Statistical Significance is used to evaluate the trend<br>over 4 to 10 periods of measure, subject to data availability and comparability.
County: Blackford Veteran Population
County: Blackford Veteran Population
7.5%
(2018-2022)
Compared to:
IN Value
(6.8%)
The regional value is compared to the Indiana State value.
US Value
(6.6%)
The regional value is compared to the national value.
Trend
This comparison measures the indicator’s values over multiple time periods.<br>The Mann-Kendall Test for Statistical Significance is used to evaluate the trend<br>over 4 to 10 periods of measure, subject to data availability and comparability.
County: Blackford
Community / Public Safety
Value
Compared to:
County: Blackford Alcohol-Impaired Driving Deaths
County: Blackford Alcohol-Impaired Driving Deaths
44.4%
Percent of driving deaths with alcohol involvement
(2017-2021)
Compared to:
IN Counties
The distribution is based on data from 92 Indiana counties.
U.S. Counties
The distribution is based on data from 3,116 U.S. counties and county equivalents.
IN Value
(18.3%)
The regional value is compared to the Indiana State value.
US Value
(26.3%)
The regional value is compared to the national value.
Prior Value
(40.0%)
Prior Value compares a measured value with the previously measured value. Confidence intervals were taken into account in determining the direction of the comparison.
Trend
This comparison measures the indicator’s values over multiple time periods.<br>The Mann-Kendall Test for Statistical Significance is used to evaluate the trend<br>over 4 to 10 periods of measure, subject to data availability and comparability.
County: Blackford
Community / Social Environment
Value
Compared to:
County: Blackford Child Abuse Rate
County: Blackford Child Abuse Rate
47.3
Cases per 1,000 children
(2017)
Compared to:
Prior Value
(39.3)
Prior Value compares a measured value with the previously measured value. Confidence intervals were not taken into account in determining the direction of the comparison.
Trend
This comparison measures the indicator’s values over multiple time periods.<br>The Mann-Kendall Test for Statistical Significance is used to evaluate the trend<br>over 4 to 10 periods of measure, subject to data availability and comparability.
County: Blackford Children in Single-Parent Households
County: Blackford Children in Single-Parent Households
20.1%
(2018-2022)
Compared to:
IN Counties
The distribution is based on data from 92 Indiana counties.
U.S. Counties
The distribution is based on data from 3,132 U.S. counties and county equivalents.
IN Value
(24.1%)
The regional value is compared to the Indiana State value.
US Value
(24.9%)
The regional value is compared to the national value.
Trend
This comparison measures the indicator’s values over multiple time periods.<br>The Mann-Kendall Test for Statistical Significance is used to evaluate the trend<br>over 4 to 10 periods of measure, subject to data availability and comparability.
County: Blackford People 65+ Living Alone
County: Blackford People 65+ Living Alone
30.8%
(2018-2022)
Compared to:
IN Counties
The distribution is based on data from 92 Indiana counties.
U.S. Counties
The distribution is based on data from 3,133 U.S. counties and county equivalents.
IN Value
(28.0%)
The regional value is compared to the Indiana State value.
US Value
(26.4%)
The regional value is compared to the national value.
Trend
This comparison measures the indicator’s values over multiple time periods.<br>The Mann-Kendall Test for Statistical Significance is used to evaluate the trend<br>over 4 to 10 periods of measure, subject to data availability and comparability.
County: Blackford People 65+ Living Alone (Count)
County: Blackford People 65+ Living Alone (Count)
797
People
(2018-2022)
Compared to:
Trend
This comparison measures the indicator’s values over multiple time periods.<br>The Mann-Kendall Test for Statistical Significance is used to evaluate the trend<br>over 4 to 10 periods of measure, subject to data availability and comparability.
County: Blackford Social Associations
County: Blackford Social Associations
13.2
Membership associations per 10,000 population
(2021)
Compared to:

IN Counties
The distribution is based on data from 92 Indiana counties.
U.S. Counties
The distribution is based on data from 3,141 U.S. counties and county equivalents.
IN Value
(11.8)
The regional value is compared to the Indiana State value.
US Value
(9.1)
The regional value is compared to the national value.
Prior Value
(14.4)
Prior Value compares a measured value with the previously measured value. Confidence intervals were not taken into account in determining the direction of the comparison.
Trend
This comparison measures the indicator’s values over multiple time periods.<br>The Mann-Kendall Test for Statistical Significance is used to evaluate the trend<br>over 4 to 10 periods of measure, subject to data availability and comparability.
County: Blackford
Community / Transportation
Value
Compared to:
County: Blackford Households without a Vehicle
County: Blackford Households without a Vehicle
9.7%
(2018-2022)
Compared to:
IN Counties
The distribution is based on data from 92 Indiana counties.
U.S. Counties
The distribution is based on data from 3,133 U.S. counties and county equivalents.
IN Value
(6.2%)
The regional value is compared to the Indiana State value.
US Value
(8.3%)
The regional value is compared to the national value.
Trend
This comparison measures the indicator’s values over multiple time periods.<br>The Mann-Kendall Test for Statistical Significance is used to evaluate the trend<br>over 4 to 10 periods of measure, subject to data availability and comparability.
County: Blackford Mean Travel Time to Work
County: Blackford Mean Travel Time to Work
25.2
Minutes
(2018-2022)
Compared to:
IN Counties
The distribution is based on data from 92 Indiana counties.
U.S. Counties
The distribution is based on data from 3,131 U.S. counties and county equivalents.
IN Value
(24.0)
The regional value is compared to the Indiana State value.
US Value
(26.7)
The regional value is compared to the national value.
Trend
This comparison measures the indicator’s values over multiple time periods.<br>The Mann-Kendall Test for Statistical Significance is used to evaluate the trend<br>over 4 to 10 periods of measure, subject to data availability and comparability.
County: Blackford Solo Drivers with a Long Commute
County: Blackford Solo Drivers with a Long Commute
39.1%
(2018-2022)
Compared to:
IN Counties
The distribution is based on data from 92 Indiana counties.
U.S. Counties
The distribution is based on data from 3,141 U.S. counties and county equivalents.
IN Value
(32.2%)
The regional value is compared to the Indiana State value.
US Value
(36.4%)
The regional value is compared to the national value.
Prior Value
(36.3%)
Prior Value compares a measured value with the previously measured value. Confidence intervals were taken into account in determining the direction of the comparison.
Trend
This comparison measures the indicator’s values over multiple time periods.<br>The Mann-Kendall Test for Statistical Significance is used to evaluate the trend<br>over 4 to 10 periods of measure, subject to data availability and comparability.
County: Blackford Workers Commuting by Public Transportation
County: Blackford Workers Commuting by Public Transportation
0.0%
(2018-2022)
Compared to:
IN Counties
The distribution is based on data from 92 Indiana counties.
U.S. Counties
(2015-2019)
The distribution is based on data from 3,142 U.S. counties and county equivalents.
IN Value
(0.7%)
The regional value is compared to the Indiana State value.
US Value
(3.8%)
The regional value is compared to the national value.
Trend
This comparison measures the indicator’s values over multiple time periods.<br>The Mann-Kendall Test for Statistical Significance is used to evaluate the trend<br>over 4 to 10 periods of measure, subject to data availability and comparability.
HP 2030 Target
(5.3%)
County: Blackford Workers who Drive Alone to Work
County: Blackford Workers who Drive Alone to Work
79.2%
(2018-2022)
Compared to:
IN Counties
The distribution is based on data from 92 Indiana counties.
U.S. Counties
The distribution is based on data from 3,133 U.S. counties and county equivalents.
IN Value
(78.7%)
The regional value is compared to the Indiana State value.
US Value
(71.7%)
The regional value is compared to the national value.
Trend
This comparison measures the indicator’s values over multiple time periods.<br>The Mann-Kendall Test for Statistical Significance is used to evaluate the trend<br>over 4 to 10 periods of measure, subject to data availability and comparability.
County: Blackford Workers who Walk to Work
County: Blackford Workers who Walk to Work
1.6%
(2018-2022)
Compared to:
IN Counties
The distribution is based on data from 92 Indiana counties.
U.S. Counties
The distribution is based on data from 3,133 U.S. counties and county equivalents.
IN Value
(2.0%)
The regional value is compared to the Indiana State value.
US Value
(2.4%)
The regional value is compared to the national value.
Trend
This comparison measures the indicator’s values over multiple time periods.<br>The Mann-Kendall Test for Statistical Significance is used to evaluate the trend<br>over 4 to 10 periods of measure, subject to data availability and comparability.
